Information, explanations, and more!
DarkHorse rates all findings with a Risk score. This score is intended to represent the relative risk that the vulnerability poses to the organization.
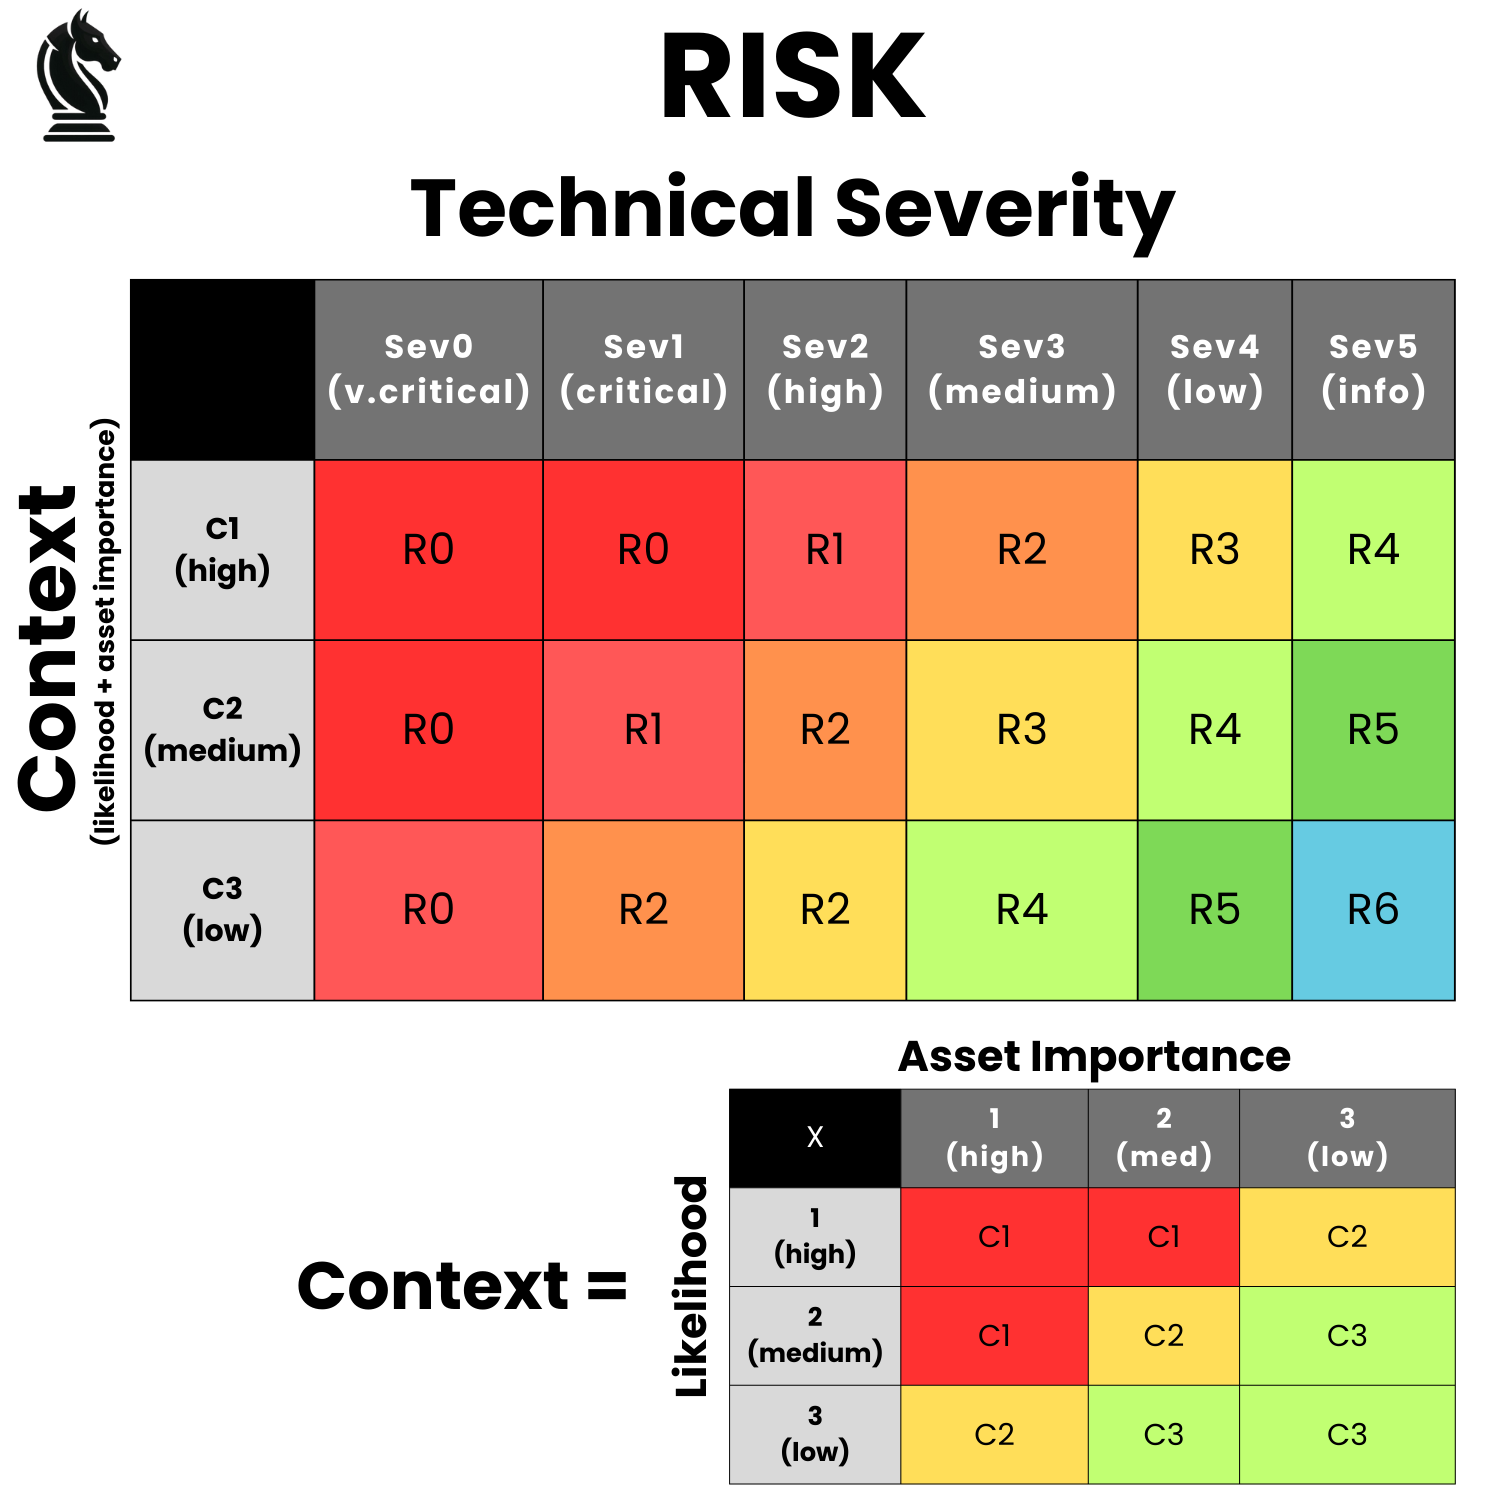
DarkHorse believes that risk is informed by two key pieces of information: (1) the technical severity of an issue (e.g. how much damage could this cause, if exploited in the wild); and (2) context. As opposed to rating purely on technical severity, our risk score provides a more complete picture that allows one to be able to more effectively prioritize that which poses the highest risk to the organization.
How the risk score is calculated is shown in the table below. You can also read our comprehensive writeup on the topic here.
Our perspective on managed triage is that it inherently contains a large amount of duplicative (and thereby inefficient) efforts. Of course, your mileage may vary, but this is our general take on the matter (it's also covered in a few places, including our whitepaper on it here):
If you get 100 reports over the course of a year, it's pretty well established in the industry that ~25-30% of those are expected to be valid, unique, in-scope reports.
You will have to replicate and interact with all of those reports.
It's also unlikely that your input won't be needed on other reports – for instance, anyone who has run a program can attest to needing to weigh in during the triage process as to whether a given report is an actual security vulnerability, or if such and such a thing is out of scope, and so on. We'll call that another 5-10% of all reports.
So, out of 100 total reports, you're having to engage on anywhere from 30-45% of what gets submitted. Said, differently, if you were previously operating from a place of "triage costs us $x per report", it's probable that the true cost was being underestimated by as much as nearly 50%.
And that's not yet taking into account that valid reports are the most time consuming category of report. Which is to say that the remaining 55-70% of reports are made up duplicates, not applicable findings, and items that are out of scope – which are non-coincidentally, the easiest finding to triage.
When we put a lower weight those types of reports, relative to valid, unique findings, it becomes clear that while triage may touch 100% of reports, you are also having to touch at least 50% of the work.
At DarkHorse, we're all about efficiency, and duplicating efforts for ~50% of the work is not something we'd consider to be efficient. Which is why we don't offer managed triage by default – because we're here to offer the simplest, most efficient option to the market. Is it economically efficient to fly on a private jet? In most cases, no. But is it convenient? Sure. Sometimes convenience outweighs the economics, especially if economics aren't a significant concern.
We make no argument that paying for managed triage isn't beneficial, and for many organizations it may still be cost-efficient. We're just presenting the facts; what you do with them is up to you.
The same principle applies to providing support – where most support issues require client interaction of some sort, it makes no sense to have a middleman for the sake of being a middleman, and so we simply don't do that.
Overview
DarkHorse supports SAML 2.0-based Single Sign-On (SSO), allowing your organization's users to authenticate using your existing Identity Provider (IdP) such as Okta, Azure AD, Google Workspace, or OneLogin.
Prerequisites
- Organization Owner access in DarkHorse
- Administrator access to your Identity Provider
- Ability to add DNS TXT records for your domain (for domain verification)
Step 1: Access SSO Configuration
- Log in to DarkHorse as an Organization Owner
- Navigate to your Organization Settings
- Click on SSO Configuration
Step 2: Add and Verify Your Domain
Before enabling SSO, you must verify ownership of your email domain:
- In the SSO Configuration panel, click Add / Manage Domains
- Enter your organization's email domain (e.g.,
yourcompany.com) - Click Submit / Save
- A unique verification token will be displayed
- Add a DNS TXT record to your domain:
darkhorse=<your-unique-token> - Return to DarkHorse and click Re-check domains
- If successful, your domain will show as Validated: True
Note: DNS changes can take up to 48 hours to propagate. Having trouble? Contact us at info@darkhorse.sh for manual verification options.
Step 3: Configure Your Identity Provider
In your Identity Provider, create a new SAML application for DarkHorse. The SSO Configuration page in DarkHorse displays the exact URLs you need to copy into your IdP:
- ACS URL – Assertion Consumer Service URL (where your IdP sends the SAML response)
- Single Logout URL (SLO) – For logout functionality
- SP Entity ID – DarkHorse's unique identifier
- SP Metadata URL – Import this into your IdP to auto-configure
- Name ID Format – Use EmailAddress format
- Required Attribute – Your IdP must send an "Email" attribute
All required URLs are displayed in the SSO Configuration panel – just click to copy.
Step 4: Enter IdP Settings in DarkHorse
From your Identity Provider, collect and enter the following into DarkHorse:
- Entity ID – Your IdP's unique identifier
- SSO URL – The Single Sign-On URL from your IdP
- SLO URL – The Single Logout URL (optional)
- x509 Certificate – Your IdP's public signing certificate (include BEGIN/END lines)
- Domain – Select your verified domain
Check SSO Enabled and click Submit / Save.
How SSO Login Works
Once configured, users can log in via SSO in two ways:
Option 1 - Via Login Page:
- Users navigate to
https://darkhorse.sh/login - They enter their email address
- If their email domain matches your SSO domain, they're redirected to your IdP
- After authenticating, they're logged into DarkHorse
Option 2 - Direct SSO URL: Users can bookmark the direct SSO login URL (shown in your SSO Configuration panel) which immediately redirects to your IdP.
Important: Organization Owners can still log in with their DarkHorse password (for emergency access). New SSO users are automatically created and linked to your organization, but will need an org owner to grant them access to specific engagements.
SP Metadata
DarkHorse provides a metadata URL (shown in your SSO Configuration panel) that can be imported into most Identity Providers to auto-configure the integration.
Need Help?
Contact us at info@darkhorse.sh for assistance with SSO configuration.
Overview
Connect DarkHorse to your Jira Cloud instance to automatically sync security reports as Jira issues. Track remediation in your existing workflow without switching tools.
Features
- Automatic sync: Reports are pushed to Jira when they reach a configured state (e.g., "Accepted")
- Manual push: Push individual reports to Jira on demand
- Bi-directional updates: Changes in Jira sync back to DarkHorse
- Custom mappings: Map DarkHorse report states to your Jira workflow statuses
- Per-engagement settings: Use different Jira projects for different engagements
Step 1: Connect Your Jira Account
- Navigate to Integrations in your organization settings
- Click Configure on the Jira card
- Click Connect to Jira
- You'll be redirected to Atlassian to authorize the connection
- Select the Jira site you want to connect and click Accept
Note: You need Jira admin permissions to authorize the connection.
Step 2: Configure Default Settings
After connecting, configure your default settings:
- Default Project: Which Jira project should receive new issues
- Issue Type: Bug, Task, Story, etc.
- Push Trigger: When should reports automatically sync (e.g., when accepted)
- Status Mappings: Map DarkHorse states to your Jira workflow statuses
Step 3: Enable Bi-Directional Sync (Webhook Setup)
To sync changes FROM Jira back to DarkHorse (e.g., status updates), you must configure a webhook in Jira:
- In DarkHorse, go to Integrations → Jira Configuration
- Copy the Webhook URL and Webhook Secret shown in the configuration
- In Jira, go to Settings → System → Webhooks
- Click Create a Webhook
- Give it a name (e.g., "DarkHorse Sync")
- Paste the Webhook URL from DarkHorse
- Paste the Webhook Secret from DarkHorse into the "Secret" field
- Under Events, check Issue → updated
- Click Save
Important: The webhook secret is required for security. Without it, Jira updates will not sync to DarkHorse.
Step 4: Per-Engagement Settings (Optional)
Override default settings for specific engagements:
- Go to the engagement's settings page
- Click on Jira Configuration
- Enable or disable Jira sync for this engagement
- Optionally set a different project, issue type, or labels
Using the Integration
Automatic Push: When a report reaches your configured trigger state, it's automatically created in Jira.
Manual Push: On any report, click the Push to Jira button to create or update the linked Jira issue.
View in Jira: Once synced, a link to the Jira issue appears on the report.
What Gets Synced
DarkHorse → Jira (when pushing):
| DarkHorse Field | Jira Field |
|---|---|
| Report Title | Summary (with severity prefix, e.g., "[HIGH] XSS in Login") |
| Severity | Priority |
| Vulnerability details, steps to reproduce, impact | Description (formatted) |
| Report State | Issue Status (via your mappings) |
Jira → DarkHorse (bi-directional, requires webhook):
| Jira Field | DarkHorse Field |
|---|---|
| Issue Status | Report State (e.g., "Done" → "Remediated") |
| Priority | Severity |
Note: Only Status and Priority sync from Jira to DarkHorse. Title and description changes in Jira are not synced back.
Default Status Mappings
When syncing from Jira to DarkHorse, these default mappings are used (case-insensitive):
| Jira Status | DarkHorse State |
|---|---|
| Open, To Do, Backlog | New |
| In Progress, In Review | Processing |
| Done, Resolved, Closed | Remediated |
| Won't Do, Rejected, Cancelled | Out of Scope |
You can customize these mappings in the Jira Configuration page.
Troubleshooting
- Can't see projects: Make sure your Jira account has access to the projects you want to use
- Push fails: Check that the issue type exists in your selected project
- Status not updating in DarkHorse: Verify the webhook is configured in Jira with the correct URL and secret
- Webhook returning 401: Ensure the webhook secret in Jira matches the one shown in DarkHorse
- Status changes not syncing: Make sure "Issue → updated" event is enabled on the Jira webhook
- Custom statuses not mapping: Add custom status mappings in the Jira Configuration page
Need Help?
Contact us at info@darkhorse.sh for assistance with Jira integration.
Overview
DarkHorse provides a REST API for programmatic access to your security data. Use the API to integrate DarkHorse with your CI/CD pipelines, SIEM systems, or custom workflows.
Step 1: Create an API Key
- Go to Integrations in your organization settings
- Click Manage API Keys
- Click Create API Key
- Enter a name (e.g., "CI/CD Pipeline" or "SIEM Integration")
- Select the permissions (scopes) the key should have
- Optionally restrict to specific engagements or IP addresses
- Important: Copy your key immediately - you won't see it again!
Step 2: Authenticate Your Requests
Include your API key in the Authorization header:
Authorization: Bearer <your-api-key>Use the entire key exactly as it was shown when you created it.
Example Request
curl -X GET "https://darkhorse.sh/api/v1/reports" \
  -H "Authorization: Bearer $YOUR_API_KEY" \
  -H "Content-Type: application/json"
Available Scopes
| Scope | Description |
|---|---|
read:reports | View reports and their details |
write:reports | Update report state and severity |
read:engagements | View engagement information |
read:organization | View organization details |
full:access | All permissions |
API Endpoints
| Method | Endpoint | Description |
|---|---|---|
| GET | /api/v1/health | Health check (no auth) |
| GET | /api/v1/entitlement | Get API key entitlements (scopes, restrictions, rate limits) |
| GET | /api/v1/reports | List all reports |
| GET | /api/v1/reports/{uuid} | Get report details |
| PATCH | /api/v1/reports/{uuid}/update | Update report |
| GET | /api/v1/engagements | List engagements |
| GET | /api/v1/organization | Get org info |
Entitlement Endpoint
The /api/v1/entitlement endpoint returns information about your API key's permissions. This is useful for:
- Verifying your API key is working correctly
- Checking what scopes are available to your key
- Seeing which engagements your key can access
Example Response:
{
  "data": {
    "key": { "name": "CI/CD Pipeline", "expires_at": null },
    "organization": { "uuid": "...", "name": "Your Org" },
    "permissions": { "scopes": ["read:reports", "read:engagements"], "scope_details": [...] },
    "allowed_engagements": null
  }
}
Interactive API Documentation
For interactive documentation with "Try it out" functionality, visit /api/v1/swagger/ (requires login).
Security Features
- Organization isolation: API keys can only access data from their own organization
- Engagement scoping: Optionally restrict keys to specific engagements
- IP restrictions: Whitelist specific IP addresses
- Expiration: Set automatic expiry dates on keys
- Audit logging: All API requests are logged
Rate Limits
API keys have a default rate limit of 1,000 requests per hour. Contact us if you need higher limits.
Need Help?
Contact us at info@darkhorse.sh for assistance with API integration.
DarkHorse Solutions Architect
Online now